BALTIMORE (Stockpickr) -- So much for yesterday's rally. Stocks faded all afternoon on Wednesday, shedding the gains that they earned to start the session. That one-day observation wouldn't be so noteworthy if not for the fact that Mr. Market has been on repeat mode for the last several weeks.
>>5 Big Charts Ready to Break Out in May
And while stocks continue to churn sideways, the worst thing you can do is sit on your hands. That's because the market's biggest gains often don't come from picking the right stocks, they come from not owning the wrong ones. That's especially true this week.
Today I'll show you five big "toxic" names you need to unload before the next leg down.
Just to be clear, the companies I'm talking about today aren't exactly junk. By that, I mean they're not next up in line at bankruptcy court. But that's frankly irrelevant; from a technical analysis standpoint, sellers are shoving around these toxic stocks right now. For that reason, fundamental investors need to decide how long they're willing to take the pain if they want to hold onto these firms in the weeks and months ahead. And for investors looking to buy one of these positions, it makes sense to wait for more favorable technical conditions (and a lower share price) before piling in.
>>5 Stocks Under $10 Set to Soar
For the unfamiliar, technical analysis is a way for investors to quantify qualitative factors, such as investor psychology, based on a stock's price action and trends. Once the domain of cloistered trading teams on Wall Street, technicals can help top traders make consistently profitable trades and can aid fundamental investors in better planning their stock execution.
So without further ado, let's take a look at five toxic stocks you should be unloading.
General Motors
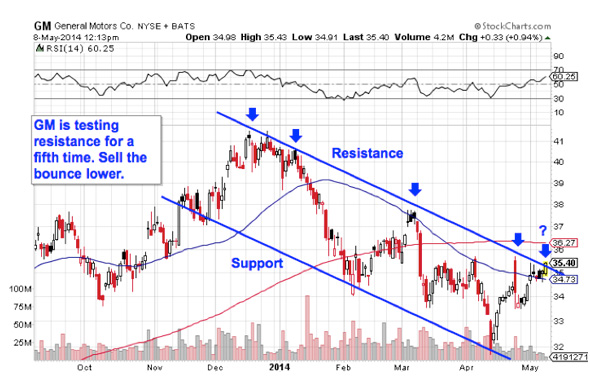
First up is General Motors (GM), a widely owned name that's done nothing but disappoint in 2014. Since the calendar flipped to January, GM has dropped 14.7%, underperforming the broad market by a big margin. And as we get deeper into May, there's reason to believe that GM is setting up for another leg down.
Charts don't get much simpler than the one in GM -- the stock is currently bouncing its way lower in a textbook downtrending channel. The setup is formed by a pair of parallel trend lines: a resistance line above shares and a support line below them. Those two lines on the chart provide traders with the high-probability range for GM's shares to stay within. When it comes to trend channels, up is good and down is bad; it's really as simple as that.
This week, as GM presses up against to the top of the channel for a fifth time, it makes sense to sell (or short) its next move lower. For investors waiting on a buying opportunity in GM, I'd recommend avoiding shares until the downtrend gets taken out. This stock could still move a lot lower before that happens.
Republic Airways Holdings
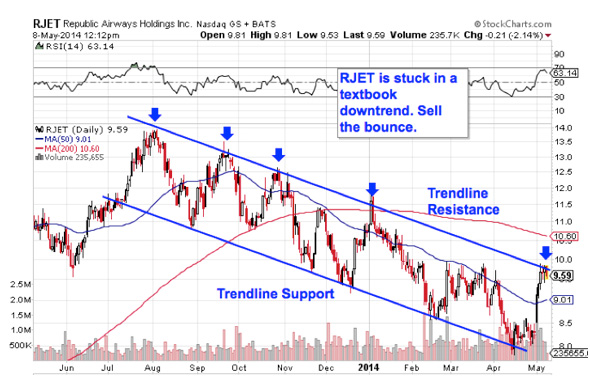
We're seeing the exact same setup right now in shares of a much smaller name: regional airline Republic Airways Holdings (RJET).
During a broad rally in the rest of the airline industry, RJET hasn't just missed the upside -- it's actually dropped close to 30% since last July. And as RJET tests trend line resistance for a fifth time over the course of this downtrend, it makes sense to sell the next bounce lower.
Waiting for that move down before clicking "sell" is a critical part of risk management, for two big reasons: It's the spot where prices are the highest within the channel, and alternatively it's the spot where you'll get the first indication that the downtrend is ending. Remember, all trend lines do eventually break, but by actually waiting for the bounce to happen first, you're ensuring that sellers are still in control before you unload shares of RJET.
Yes, waiting for the bounce means leaving some money on the table in RJET, but it greatly increases the probability that you're putting yourself on the right side of the trade.
Brunswick
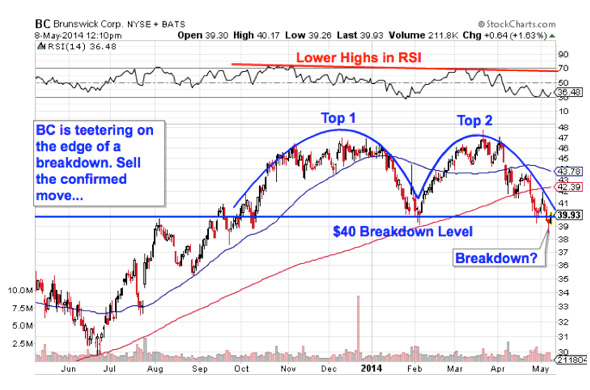
The last year or so has looked a lot stronger for shares of Brunswick (BC): The diversified mid-cap has rallied more than 24% since last summer. But that rally could be coming to an end for BC in May, and it's time to think about taking gains.
That's because Brunswick is currently forming a double top, a bearish reversal pattern that looks just like it sounds. The double top is formed by a pair of swing highs that max out at approximately the same price level. The sell signal comes when the trough that separates the two highs gets violated. For BC, that breakdown level is right at $40, a price level that's getting tested this week.
If shares are still hanging out below $40 early in today's session, consider it a confirmed sell signal. Momentum, measured by 14-day RSI, provides some foreshadowing for downside in BC. While price was steady over the two tops in Brunswick, our momentum gauge failed to do the same. That's a big red flag.
Towers Watson
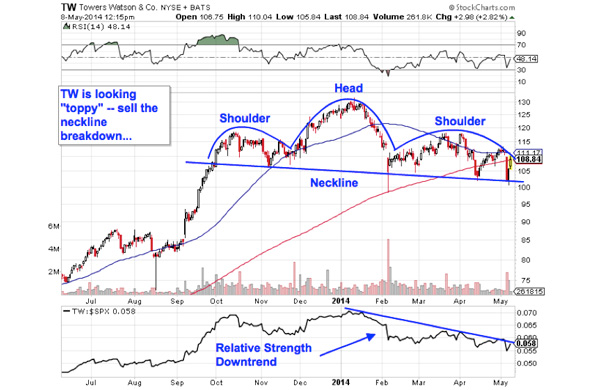
Towers Watson (TW) is another name that's looking "toppy" after a big run higher in the past year. Shares of TW are up more than 44% over the trailing 12 months, besting the performance of the S&P 500 nearly three times over. But that rally could be coming to a screeching halt thanks to a classic technical reversal pattern in shares. Put simply, TW looks toxic right now.
Towers Watson is currently forming a textbook head and shoulders top, a bearish reversal pattern that indicates exhaustion among buyers. The setup is formed by two swing highs that top out at approximately the same level (the shoulders), separated by a higher high (the head). The sell signal comes on a move through TW's neckline, which is currently right above $100. If TW can't catch a bid above $100, it becomes a sell.
Another indicator, relative strength (not to be confused with RSI), is the side signal that's pointing to downside in TW in May. Relative strength has been trending lower since January, indicating that TW is woefully underperforming the broad market in 2014.
It's tempting, but don't discount the head and shoulders pattern just because of its name. After all, the only thing that matters is its efficacy: a recent academic study conducted by the Federal Reserve Board of New York found that the results of 10,000 computer-simulated head-and-shoulders trades resulted in "profits [that] would have been both statistically and economically significant."
Pfizer
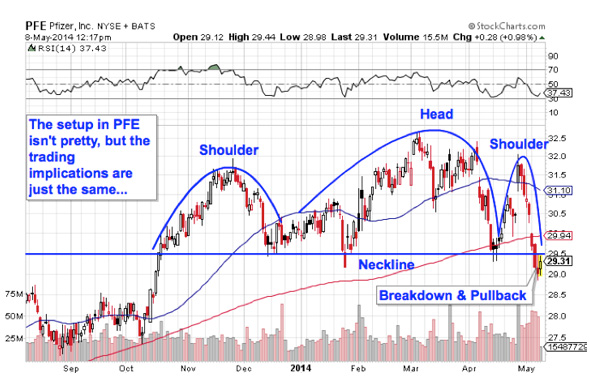
Last up is Pfizer (PFE). The pharmaceutical giant is forming the exact same setup as the one in TW right now -- and while the chart may not be quite as pretty in PFE, the trading implications are exactly the same. Pfizer broke through its neckline at $29.50 earlier in the week. Now a pullback is giving shorts a second chance at a low-risk entry on this stock.
Why the significance at $29.50? Whenever you're looking at any technical price pattern, it's critical to keep buyers and sellers in mind. Patterns like head and shoulders setups and double tops are a good way to quickly describe what's going on in a stock, but they're not the reason it's tradable. Instead, it all comes down to supply and demand for shares.
That horizontal $29.50 neckline level in PFE is the spot where there's previously been an excess of demand for shares; in other words, it's a price where buyers have been more eager to step in and buy shares at a lower price than sellers were to sell. That's what makes a breakdown below support so significant -- the move means that sellers are finally strong enough to absorb all of the excess demand at the at price level.
For the best risk/reward tradeoff, wait for the next move lower before selling PFE.
To see this week's trades in action, check out the Toxic Stocks portfolio on Stockpickr.
-- Written by Jonas Elmerraji in Baltimore.
RELATED LINKS:
>>5 Stocks Insiders Love Right Now
>>Fight the Selling With These 5 Trades
>>5 Short-Squeeze Stocks Poised to Pop
Follow Stockpickr on Twitter and become a fan on Facebook.
At the time of publication, author had no positions in stocks mentioned.
Jonas Elmerraji, CMT, is a senior market analyst at Agora Financial in Baltimore and a contributor to
TheStreet. Before that, he managed a portfolio of stocks for an investment advisory returned 15% in 2008. He has been featured in Forbes , Investor's Business Daily, and on CNBC.com. Jonas holds a degree in financial economics from UMBC and the Chartered Market Technician designation.Follow Jonas on Twitter @JonasElmerraji
No comments:
Post a Comment